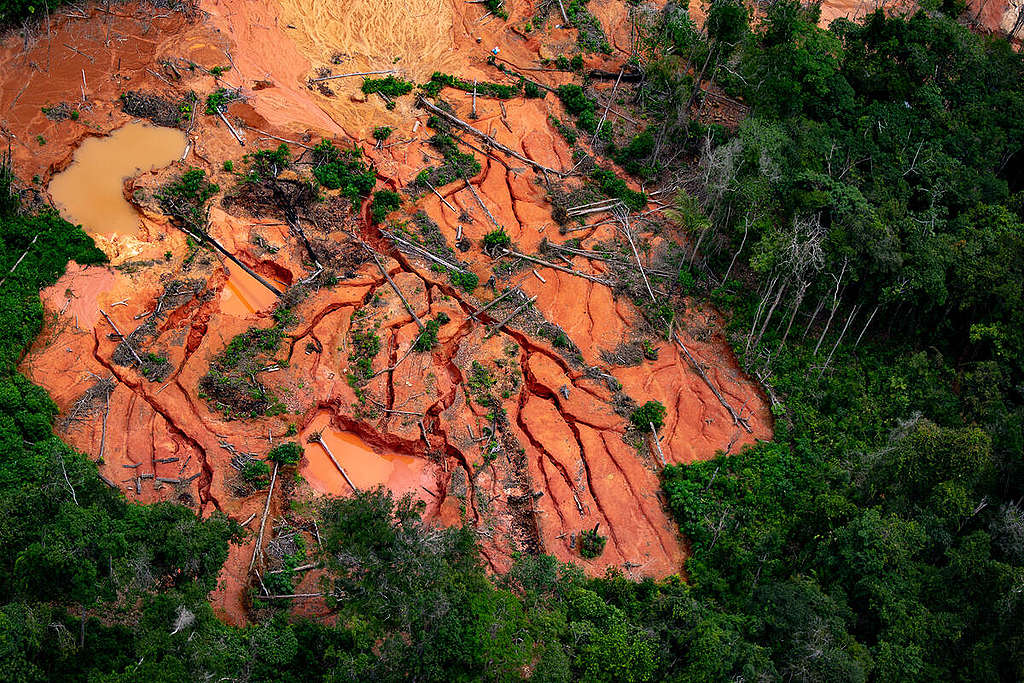
The Amazon rainforest, known for its rich biodiversity and vital role in regulating the Earth’s climate, has been facing a grave threat in the form of deforestation. This destructive practice has led to significant habitat destruction, biodiversity loss, and contributes to climate change. A key factor exacerbating this devastation is the sharp increase in illegal gold mining activities observed in the region over the past decade. Motivated by the soaring global gold price, individuals have engaged in unlawful mining practices within the Amazon rainforest, further exacerbating the environmental crisis.
Traditional labor-intensive methods involving the hiring of local citizens to spot illegal activities have proven to be costly and time-consuming. Fortunately, advancements in satellite technology have opened new avenues for detecting illegal mining activities using satellite images and employing machine learning techniques like image classification.
The primary objective of this project is to develop an algorithm for labeling unlabeled image chips. The primary focus is on detecting the occurrence of ‘artisanal mining,’ commonly referred to as illegal mining, among a set of 16 labels categorized into three main groups: atmospheric conditions, common land uses and rare land uses. Image chips may receive none or more than one label from these groups.
The main objectives include:
-
Train a Model with Labeled Image Chips:
- Develop an algorithm that effectively labels unlabeled satellite image chips, considering atmospheric conditions and land uses as label categories.
-
Detection of Artisanal Mining (Illegal Mining):
- Create a model that reliably identifies the presence of ‘artisanal mining’ (illegal mining) as one of the rare labels among others.
- Differentiate between various classes of land cover and land use, emphasizing the detection of illegal mining activities.
-
Improved Understanding of Environmental Conditions:
-
Utilize the model to enhance the understanding of environmental conditions, particularly in relation to deforestation and illegal mining activities on a global scale.
-
Contribute to the identification and interpretation of patterns and causes of deforestation through the labeled satellite imagery.
-
Challenges
The challenge of the project lies in addressing the highly imbalanced distribution of data labels among the 16 groups. Specifically, the difficulty arises from the fact that the ‘artisanal mine’ label constitutes less than 1% of the total population.


Key Challenges:
- Blurry Image Challenge:
- A significant amount of satellite image chips appears to be blurry. Therefore a dehazing function may be necessary to enhance the clarity of these images before feeding them into the model.
- Addressing blurry images is crucial for ensuring that the model can effectively learn and make accurate predictions, particularly in regions where haziness may impact the interpretability of features.
- Imbalanced Data Distribution:
- Imbalanced data can lead to model bias, where the model may struggle to accurately identify and classify the minority class due to insufficient examples for learning.
- Risk of Misclassification:
- The imbalanced distribution increases the risk of misclassification, especially for the minority class. The model may be heavily biased towards predicting the majority classes.
- Model Training Complexity:
- The model needs to be trained to handle the rarity of the ‘artisanal mine’ label while maintaining performance across the other more prevalent labels.
- Data Augmentation and Sampling Strategies:
- Balancing techniques, such as oversampling, undersampling, or the use of synthetic data, may need to be implemented to ensure fair learning across all classes.
First Attempt
My initial attempt involved using a random forest with computed features such as haziness, image contrast, and RGB color channels. However, this approach proved unsuccessful, as the model struggled to differentiate the most basic weather conditions. Consequently, attention shifted towards a convolutional neural network (CNN), known for its prowess in capturing and extracting essential local features for pattern and object identification. While successful in discerning weather labels and common land uses, the CNN faced challenges in predicting rare land use labels, despite extensive training. Even after implementing oversampling techniques, the model not only failed to improve accuracy but also exacerbated the recall score, resulting in misclassifications of other labels as mining activities.
In light of those challenges, I explored alternative approaches to improve model performance, particularly in predicting the 1% population representing rare land use categories.
- Update computational power: use AWS GPU
- More advanced network designs
- Improve input image quality
- Rotate and flip images to increase the sample size
Update computational power
To harness the power of advanced hardware and accelerate the training process, an AWS GPU instance was utilized. The use of GPU computing combined with multi-processing technique allows for parallel processing and faster model training, enabling more efficient experimentation and optimization. Additionally, cross-validation was implemented to continuously monitor the model’s performance across multiple iterations, ensuring that overfitting issues were identified and addressed promptly.
Advanced network designs - DenseNet
To further improve the model’s performance and accuracy, a customized neural net model was implemented using DenseNet architecture. This deep neural network design introduces dense connections between layers, allowing for direct information flow and gradient propagation throughout the network. This architecture alleviates the vanishing gradient problem, encourages feature reuse and leads to better parameter efficiency and faster convergence during training.The Python package named Keras was employed to create and connect different neural network layers, with binary cross-entropy serving as the loss function.
\[\text{Binary Crossentropy } = -\sum y_i log({\hat{y}}_i)+(1-y_i)log({1-\hat{y}}_i)\], where y is the true probability and ŷ is the predicted probability. The binary cross-entropy loss function is particularly effective in multi-class problems. In this context, let’s consider a three-class problem with \(y_A=1, y_B=1, y_C=0\). Suppose the model predicts \(ŷ_A=0.4, ŷ_B=0.7, ŷ_C=0.1\). The loss is calculated as -(log(0.4)+log(0.7)+log(0.9)) = 0.60. As the predicted y of A and B approaches the correct answer 1, the loss function becomes small. Conversely, if predicted probability of A is close to zero, the loss becomes a large number. Same applies to \(y_C\) when it approaches to 0.
As a result, the new model benefits from requiring fewer parameters and faster convergence compared to CNN. It accelerates the training process and mitigates overfitting risk. This approach encourages the model to learn more robust and generalized features from the data, ultimately improving performance and accuracy.
Improve image quality
Satellite images often suffer from darkness and blurriness caused by atmospheric turbulence. However, by mitigating the effects of haze and improving image quality, we can enhance the performance of neural networks. Leveraging my understanding of atmospheric physics and conducting research on Google Scholars, I developed a dehaze function based on a paper to address this challenge. Haze results from the scattering of light in the atmosphere before it reaches the camera. To estimate the intensity of scattered light, a constant value is derived by approximating the maximum pixel intensity within the darkest RGB channel. By utilizing OpenCV to convert images to a colorspace matrix and calculating the haze constant, we can restore the image by subtracting this value. As a result, the dehazed image appears brighter and exhibits better contrast, improving the quality of input data for neural networks.
 Figure 3: Formation of a hazy image. Camera = Direct attenuation+Airlight
 Figure4 : Examples of satellite image chips before and after haze removal
The impact of the dehazing process is evident, as it leads to a substantial improvement in image quality across most samples. Upon the application of the haze removal function, the image undergoes a remarkable transformation. The contrast is restored, bringing out more vivid and distinct features. The sharpness of objects is improved, and details that were previously obscured by haze become more visible. Colors, regaining vibrancy and accuracy, contribute to a clearer and more faithful representation of the scene. Overall, the haze removal function significantly elevates the image visibility and quality by reducing the impact of atmospheric interference.
The choice of F2 score as the performance metric is deliberate due to the uneven distribution of label classes, where recall takes precedence over precision. Recall measures the ability to capture all positive instances correctly. In the specific context of identifying labels associated with mining, a high recall implies the model’s effectiveness in detecting actual mining instances, thereby minimizing the occurrence of false negatives (missed mining instances). The F2 score, by assigning greater weight to recall, ensures that the model adeptly identifies as many positive instances as possible while maintaining a reasonable level of precision. This strategic emphasis aligns with the objective of optimizing performance in scenarios where missing positive instances carries a higher cost than false positives.

Figure 5: F2 score before (purple) and after (blue) the haze removal function. Notice it dramatically improve the results for rare land use labels
Work Flow

Model performance
After training the DenseNet model on the dehazed image sets, the model was saved as “b01_dense121.h5”. This trained model was then utilized to generate labels for the previously unlabelled test set images. The model successfully identified several test photo chips as illegal mines, providing valuable insights into the presence of illegal mining activities in the dataset.
 Figure 6. Examples from the test data that were marked as illegal mines with labels generated by the DenseNet model.
In summary, the project focused on developing a model to detect illegal mining and rare land use cases using satellite images. Several approaches were employed to address the challenges of imbalanced labels, low image quality, and underfitting. These approaches included improving computational power, rotating images of rare land use categories, using more advanced network designs like DenseNet, and enhancing input image quality through haze removal. The implementation of these approaches resulted in significant improvements in both precision and recall, particularly for the rare land use cases.